Finally Notion Charts Are Here

Notions' new native charts are finally here! Learn to effortlessly visualise multiple types of charts and enhance your productivity.

23 sie 2024

Notion

5 min

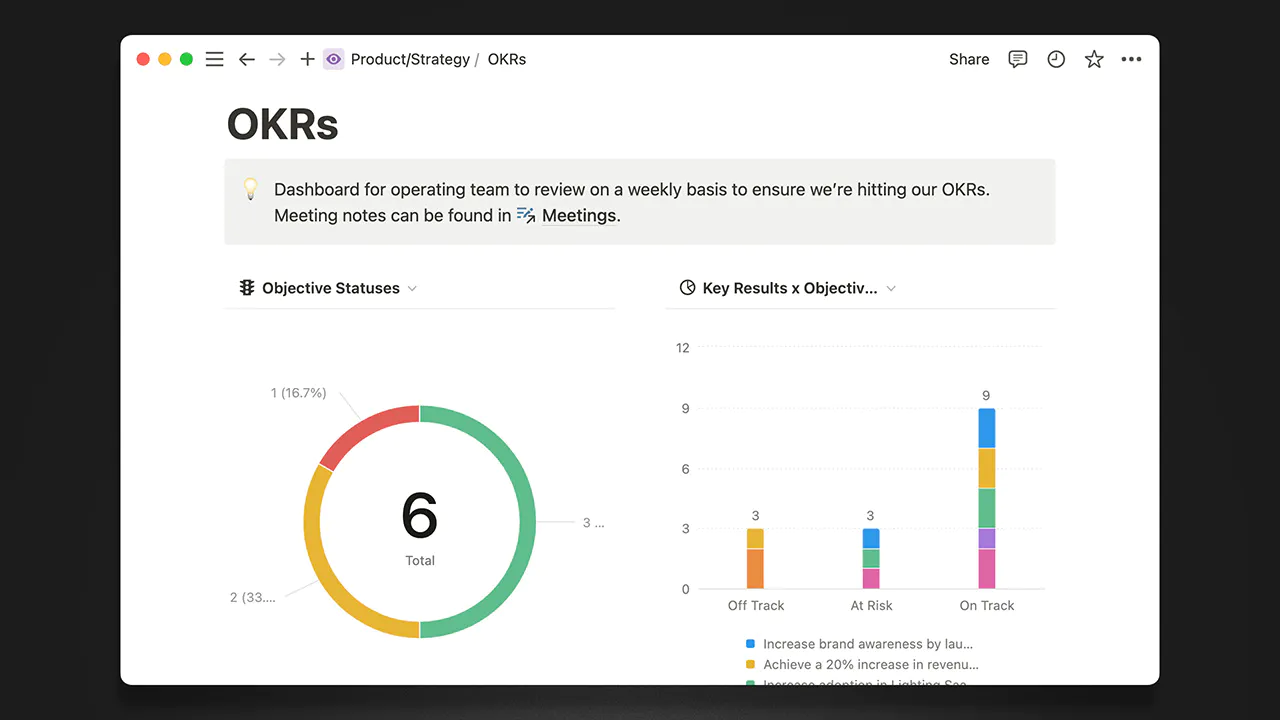
Dashboard OKR w Notion prezentujący nowe funkcje wykresów: elegancki interfejs wyświetlający stronę 'Produkt/Strategia / OKR'y' z dwoma wizualizacjami danych. Lewa: kolorowy wykres donut podsumowujący 6 całkowitych celów wraz z ich statusami. Prawa: wykres słupkowy porównujący kluczowe wyniki 'Za daleko', 'W niebezpieczeństwie' i 'W dobrym stanie' w wielu celach. Ten przykład demonstruje, jak Lucas Ostrowski wykorzystuje zaawansowane możliwości wykresów w Notion do skutecznego śledzenia OKR-ów i wizualizacji projektów bez kodowania.

Notion has finally launched a long-awaited feature: native charts! This exciting addition lets you easily visualise your data directly in Notion, eliminating third-party tools. Let's explore how Notion Charts can transform your workspace and streamline your data visualisation process.

TL;DR

  • Native Feature: Notion now offers native charts, allowing users to create various chart types directly from their database.

  • Automatic Updates: Charts automatically refresh when the underlying data changes, ensuring real-time accuracy.

  • Customisation: Charts can be easily integrated with existing notion databases.

  • Future Enhancements: Notion works to introduce more advanced features.

What are Notion Charts?
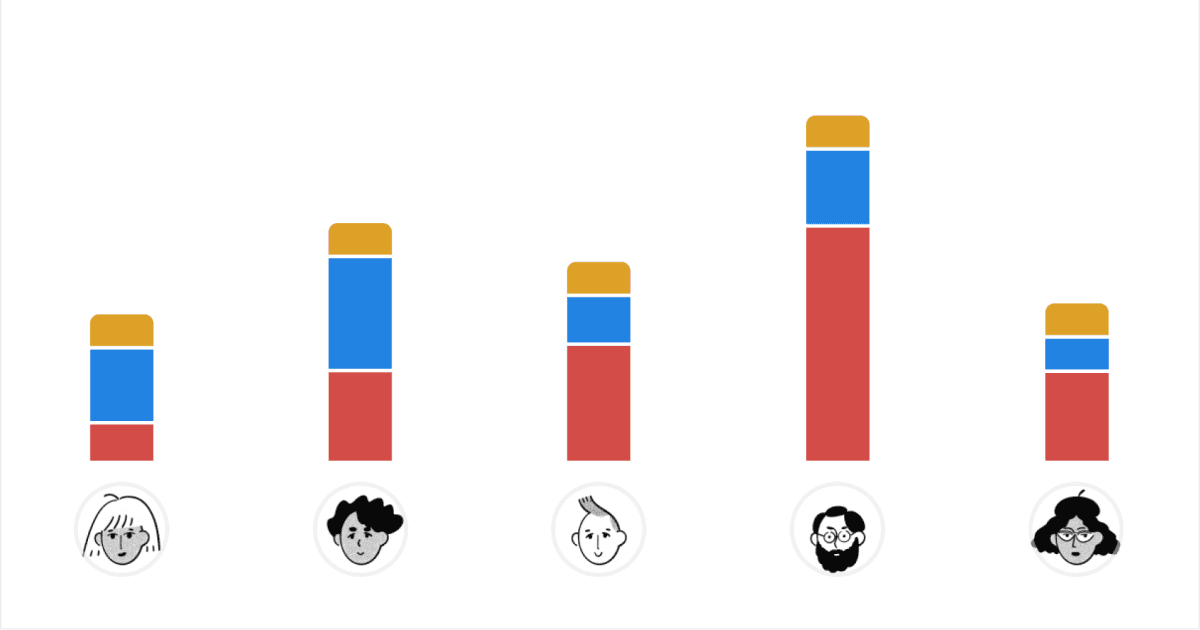
Notion stacked bar chart example: Five columns representing data for different team members, showcasing Notion's new charting capabilities. Each column is divided into three color-coded segments (gold, blue, red) illustrating multiple data points per person. Simple cartoon avatars below each column personalize the data visualization, demonstrating how Lucas Ostrowski leverages Notion's latest features for effective team performance tracking and no-code data representation.

Source: Notion

Charts in Notion are precisely what you expect them to be — a visual representation of your data. They allow you to create diagrams and images representing your data directly within Notion.

Available Types of Notion Charts

  1. Pie Charts:

  2. Bar Charts:

  3. Line Charts:

  4. Muti-Series Charts:

How to create a Chart in Notion

  1. Insert a chart: Type /chart in your Notion page to start adding a chart.

  2. Select chart Type: Choose from available options.

  3. Configure data: Select which data you want to display on the "X" and "Y" axes.

  4. Customise Your Chart: Adjust colours, axis names, labels, etc., to fit your expectations.

Use Cases for Notion Charts

Project Progress Tracking

You can use line charts to visualise the completion status of tasks over time, helping teams monitor project milestones.

Sales Data Analysis

Choose bar charts to represent sales trends, allowing businesses to identify peak periods and areas for improvement quickly.

Personal Goal Monitoring

Create doughnut charts to illustrate time spent on various personal goals, providing an overview of your priorities and progress.

Finance Management

Utilise column charts to track expenses across different categories, which allows you to manage your budget more effectively.

Team Performance Comparison

Use bar charts to compare task completion rates among team members, fostering accountability and encouraging collaboration.

Advantages Over Third-Party Solutions

Seamless Integration: All your data and its visualisation are directly in Notion. You do not need to export your data or create additional accounts.

Automatic Updates: Your Notion Charts refresh any time the underlying database changes, with real-time accuracy without manual intervention.

User-Friendly: You can customise chart types, colours, and labels, providing flexibility to build visualisations for your needs.

Current limitations of Notion Charts

Although Notion Charts was a long-awaited feature and a great addition to data visualisation, it still has some limitations. They lack advanced data manipulation features, which you can find in dedicated spreadsheet tools. Additionally, the customisation options, though useful, might not be enough for some highly specialised charting capabilities.

Conclusion

When Notion Charts are finally introduced, you can easily visualise data within your workspace. While there are still some limitations, the seamless integration and real-time updates make it a powerful tool and are enough in most cases.


——

Not using notion yet? Create a free Notion account here.
Najlepsze szablony

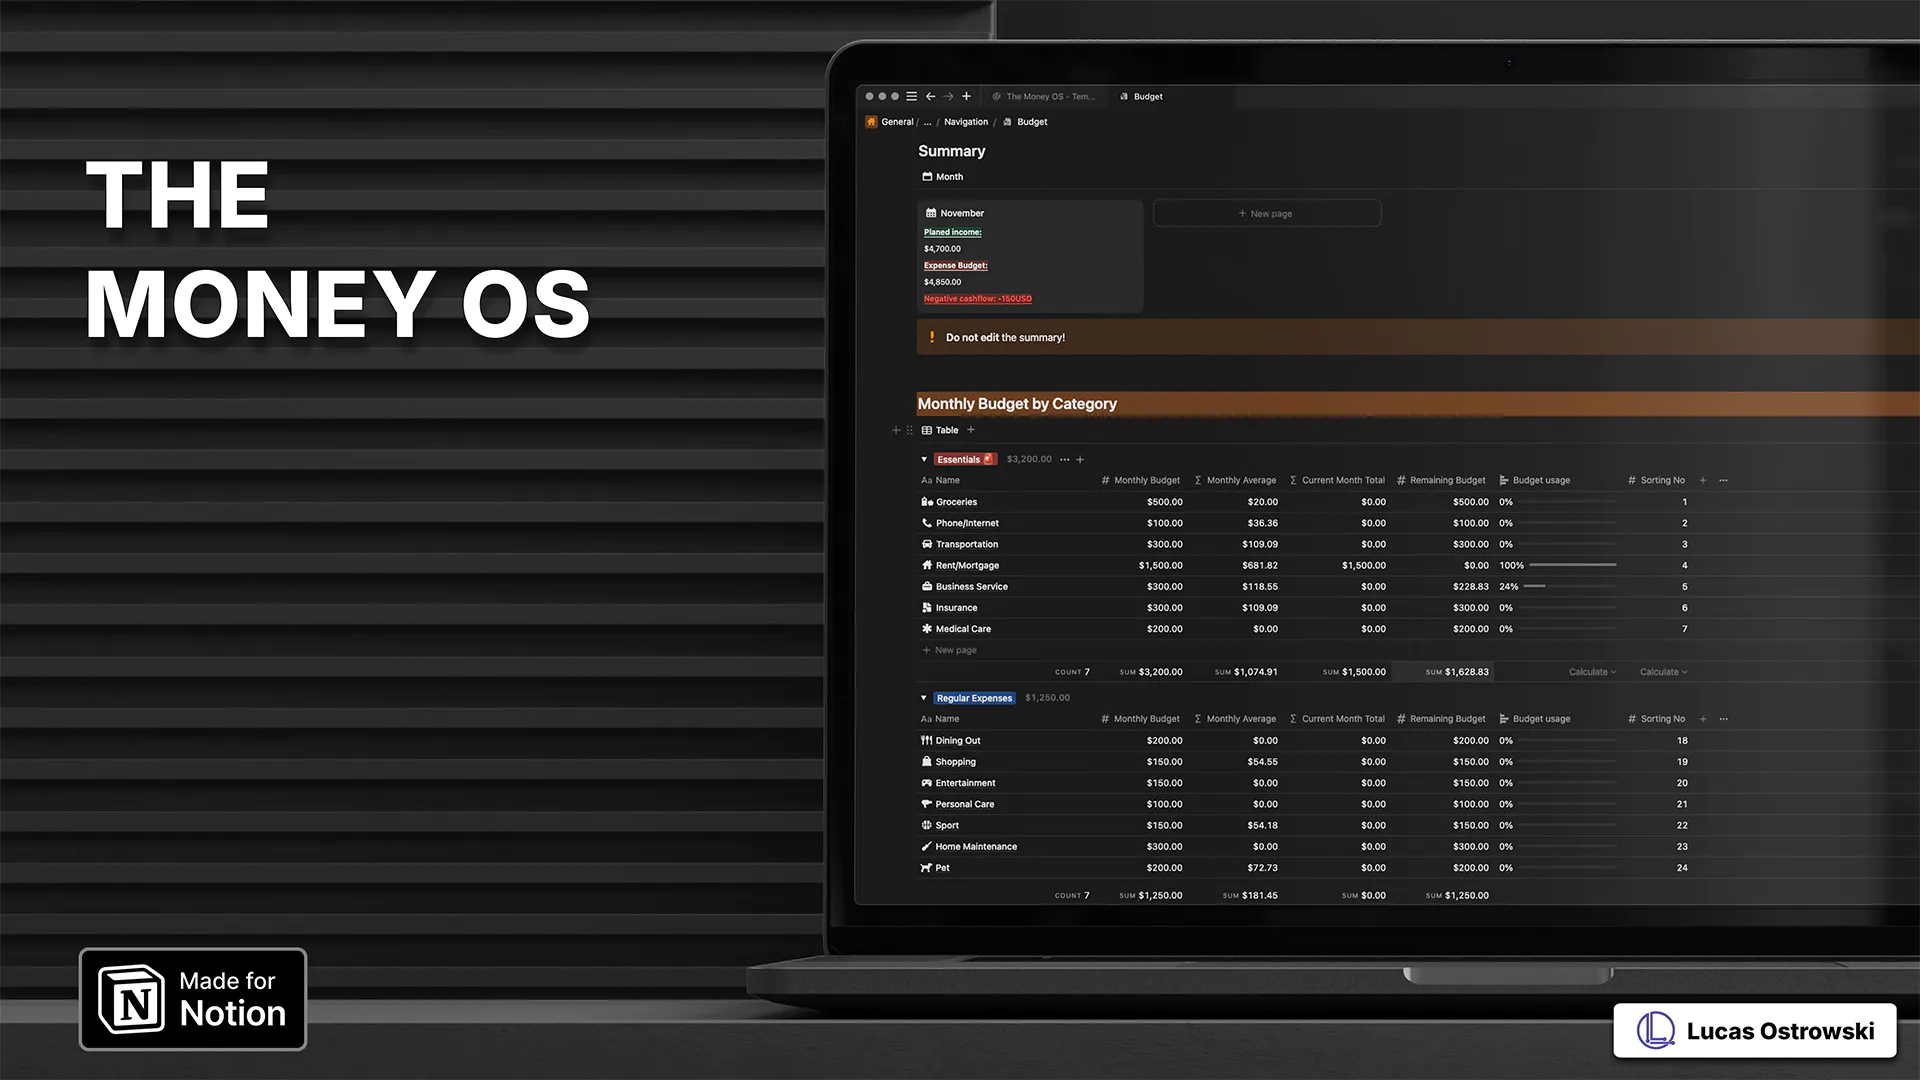
The Money OS Notion template displayed on two MacBook laptops against a dark, professional backdrop. Left screen shows sophisticated financial analytics with multiple line graphs tracking income and expenses over time. Right screen demonstrates the dark-mode interface with navigation icons and current month financial tracking. 'Made for Notion' badge in top-left corner emphasizes native integration. Stylish product visualization highlighting The Money OS's comprehensive financial management and analysis capabilities in a modern, premium presentation.
Notion SEO Keywords Generator template shown on laptop display featuring dark mode interface. Screenshot shows keyword research dashboard with metrics like search volume, KW intent, and CPC. Made for Notion badge and Lucas Ostrowski branding visible. Professional SEO tool for content optimization and keyword tracking.
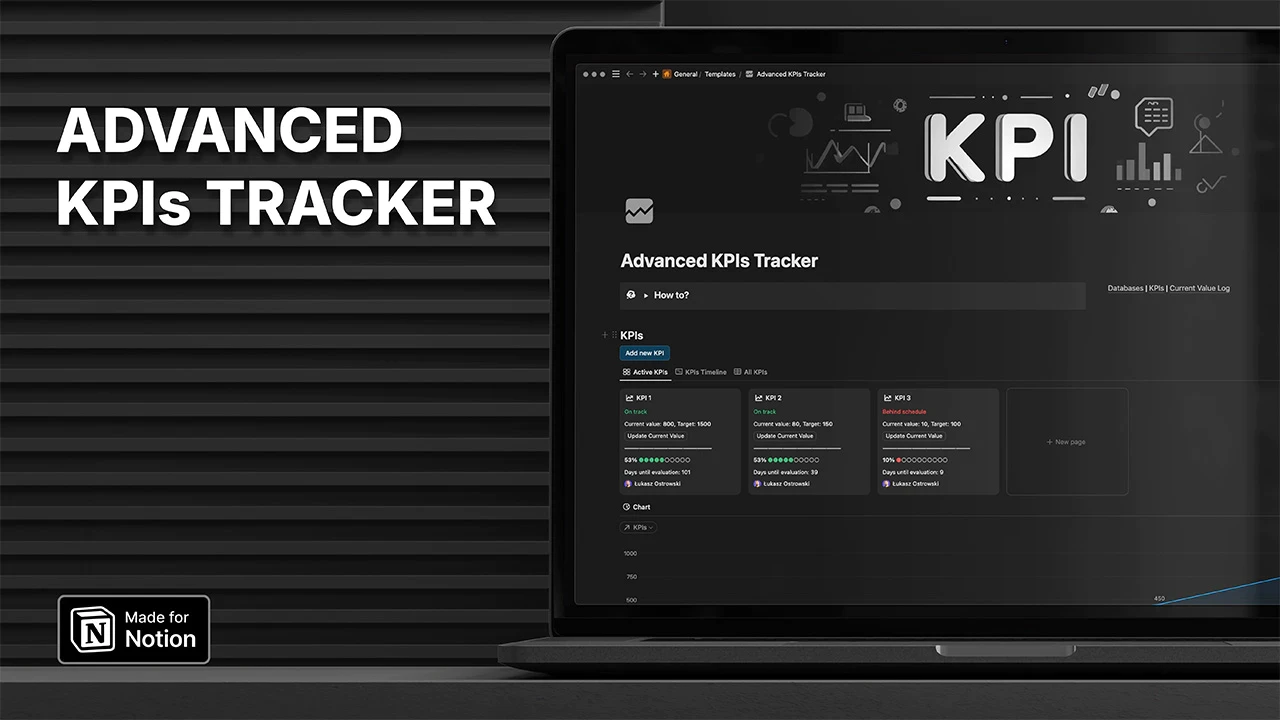
Advanced KPIs Tracker Notion template: Dark-mode interface with KPI dashboard, progress bars, and performance chart on laptop screen. Made for Notion."
Table of contents

Title

Title

Title

Dołącz do ponad tysiąca czytelników

Uzyskaj najnowsze informacje na temat AI, automatyzacji i systemów mających na celu optymalizację twojego życia i biznesu.

Dołącz do ponad tysiąca czytelników

Uzyskaj najnowsze informacje na temat AI, automatyzacji i systemów mających na celu optymalizację twojego życia i biznesu.

Dołącz do ponad tysiąca czytelników

Uzyskaj najnowsze informacje na temat AI, automatyzacji i systemów mających na celu optymalizację twojego życia i biznesu.